AI in Luxury Market Intelligence: Your AI Is the New Analyst, but Who Briefed It?
Luxury teams can now get competitive answers in seconds rather than days. That speed is only worth having when the assistant is grounded in governed, luxury-specific data that shows its source, its window and its sample.
Luxury has entered a slower, more exacting cycle. The Bain-Altagamma Luxury Goods Worldwide Market Study estimates that personal luxury goods sales reached €358 billion in 2025, a 2% decline at current exchange rates, with about 20 million consumers leaving the market over the year. In a market that no longer rewards every move, decisions on pricing, allocation and media carry more weight, and so does the speed and accuracy of the intelligence behind them.
At the same time, AI has moved from experiment to priority. DLG’s The State of AI in Luxury, produced with Europa Star and based on a survey of more than 250 luxury executives, finds that 71% acknowledge AI adoption cannot be delayed, yet 42% of brands remain in an experimentation bottleneck. Data fragmentation, cited by 37% of executives, leads the list of barriers. Ambition has run ahead of readiness.
Market reports used to take days. Exports had to be pulled, definitions reconciled and charts redrawn, and a single late question could send half the work back to the start. Today, the same work can be done in about 90% less time. The reason is not simply AI. It is what the AI is briefed with.
The Cost of “Let Me Get Back to You”
Every luxury marketing or commercial team knows the exchange. An executive asks whether a competitor’s launch is working, or where the house’s prices sit against peers, and the analyst promises to come back with an answer. Behind that promise sits a great deal of manual work. A question that takes a minute to ask can take days to answer, and competitive intelligence absorbs analyst time, agency hours and subscriptions in collecting data rather than reading it.
The consequence is less visible than the delay. The slower the answer, the more often the decision is made on instinct, or on last quarter’s deck. And some decisions are never made at all, because the blind spot stays invisible.
The Risk in the Shortcut
So teams turn to AI. Imagine a CMO at a Swiss watch house who, at 8:02 on a Monday morning, asks her team’s assistant whether the pre-owned market for her flagship collection has re-rated over the past three months. Four seconds later she has a confident, well-structured answer, with a number, a cause and a recommendation. Nobody has checked it.
A general-purpose model answers from the open web and its training data: dealer blogs, forum threads, press commentary and old price guides. It has no access to the history of grey and pre-owned listings, the catalogue price behind each reference or the creatives competitors launched that week. Where data is missing, it tends to fill the gap with something plausible, and in luxury the cost is a price set against a premium that is not there, or an allocation moved on noise.
AI has not made analysis worse. It has made unverified analysis indistinguishable from the verified kind.
The Missing Layer of Luxury Intelligence
The assistant is not short of intelligence. It is short of luxury intelligence: the nuances and the specific metrics that measure how desirable a brand is. Desirability is not a single figure but a combination of share of search, the premium or discount at which a watch trades against retail, engagement per post, advertising presence and price architecture, read together and read correctly.
This is the layer DLG has built into LuxuryIQ Connect, which links the assistants teams already use, including Claude, ChatGPT, Gemini and Copilot, to governed luxury market data through the Model Context Protocol (MCP) or Agent-to-Agent (A2A). It draws on more than 1.5 billion data points across seven domains, from the secondary market and catalogue prices to search, social, paid media, point-of-sale tracking and KOL monitoring, with documented metric definitions and written method rules beneath them.
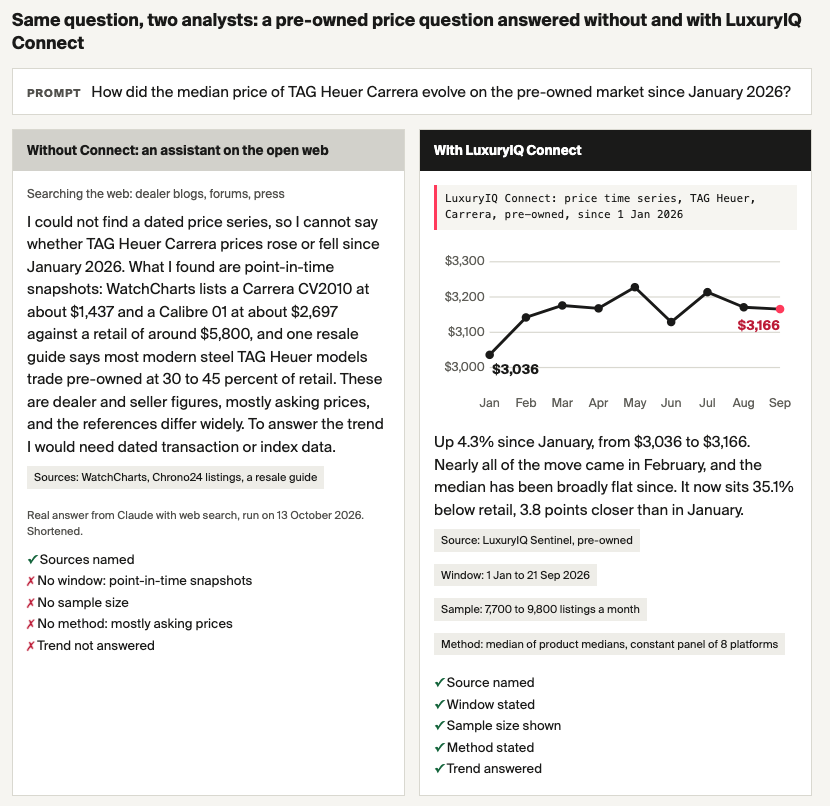
The difference shows in a simple test. Asked how the median pre-owned price of the TAG Heuer Carrera had moved since January 2026, Claude using web search alone returned point-in-time snapshots from dealer and listing sites, mostly asking prices across very different references, and acknowledged that it could not establish a trend.
Routed through LuxuryIQ Connect, the same question returned a series. According to LuxuryIQ Sentinel, the median rose 4.3% between 1 January and 21 September 2026, from US$3,036 to US$3,166, with nearly all of the move coming in February. It now sits 35.1% below retail, 3.8 points closer than in January, and the answer states its sample of 7,700 to 9,800 listings a month and its method, a constant panel of eight platforms.
Source: LuxuryIQ, TAG Heuer Carrera pre-owned listings, 1 January to 21 September 2026; median of product medians on a constant panel of eight platforms. Web-only answer produced by Claude with web search on 13 October 2026, shortened.
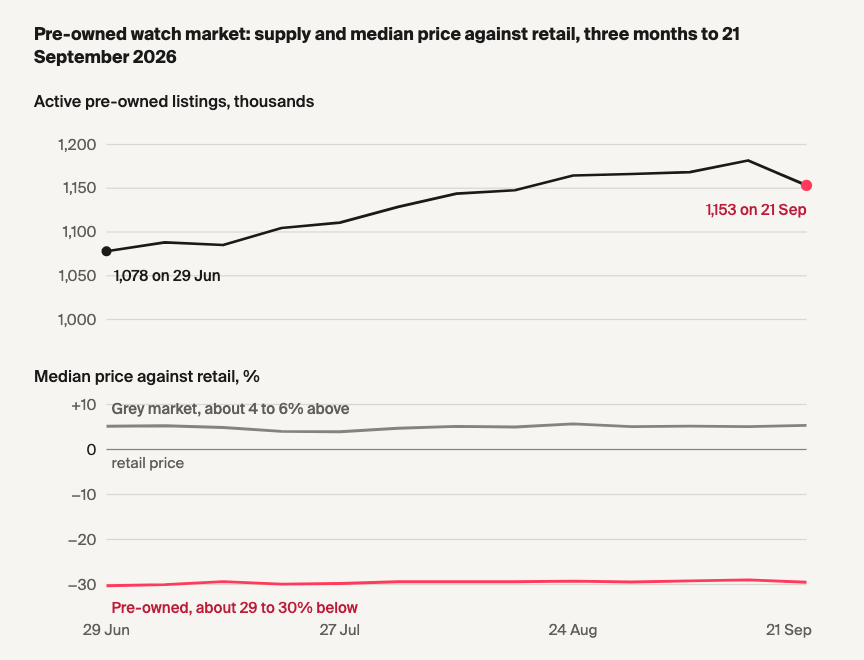
History is what gives the number meaning. A premium is only a signal against its own past. Applied to the CMO’s question, the grounded answer is that the market has not re-rated. Over the three months to 21 September 2026, active pre-owned watch listings in LuxuryIQ’s panel rose 7.0%, from 1.08 million to 1.15 million, while the median pre-owned price held 29% to 30% below retail and grey-market listings sat about 4% to 6% above it.
Both answers take the same four seconds. Only one shows its working.
Source: LuxuryIQ Sentinel, active listings, weekly snapshots; median premium on listings matched to a retail price.
One Word, Many Meanings
Grounding fixes the source but not the vocabulary, and in a global house vocabulary is where reporting quietly breaks. The engagement rate can be pooled across an audience, averaged per post or taken from the median post. On Instagram, LuxuryIQ data shows the top 1% of posts carrying 36.6% of all engagement, so the three methods return different numbers. On WeChat the rate is calculated on views rather than followers, which makes it incomparable with Instagram altogether.
“Grey market” is a classification, not a fact. Over the same months, grey listings sat above retail while pre-owned sat about 29% to 30% below it, so an average of the two describes nothing anyone is selling. The remedy is one brand taxonomy, one metric dictionary and written method rules shared across markets and functions. When the CMO, the media team and a local market manager each ask their own AI the same question, they should get the same number, and be able to see why.
What Joined Data Reveals
Once every domain shares a single brand spine, strategy questions become a matter of plotting one domain against another. Of 39 watch brands with at least 100 matched grey listings in August 2026, only three combine a high share of search with a grey premium of 5% or more over retail, while 28 sit at or below retail with modest demand.
Set Meta advertising against search and a different pattern emerges. Of 28 brands with at least 20 watch ads live in August 2026, 22 hold a larger share of ads than of search. Patek Philippe, Audemars Piguet and Rolex, the three houses that lead this set on grey premium, are among the six that advertise below their share of demand.
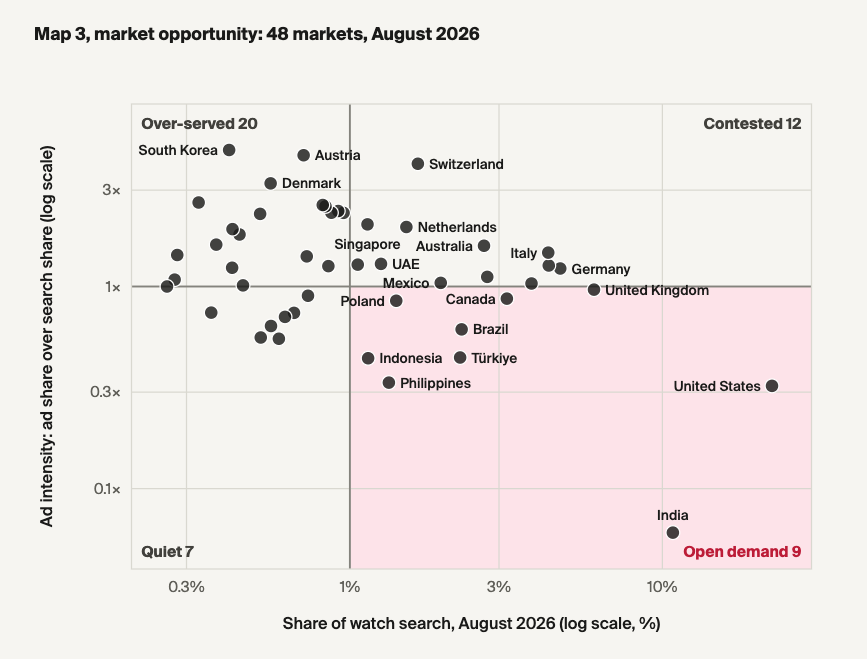
The same logic works by market. Across 48 markets, India holds 10.8% of watch search but 0.65% of Meta watch ad placements, while Switzerland carries four times the ad share its search implies. The limits matter here: presence is not spend, since Meta’s library holds no budget data. This is a map of voice, not of investment.
Source: LuxuryIQ, Google Keyword Planner watch search volumes by market (excluding Global) and Meta Ad Library watch ad placements live in August 2026. Intensity is ad share divided by search share; 1 is parity.
The public ad library can also be read as a competitor’s calendar. Over the 52 weeks to 21 September 2026, TAG Heuer launched new watch ads in every week, kept an ad live for a median of 11 days and ran mostly in France, the UK and Japan. Its peak week, 555 new ads in the week of 20 April, followed news of the Monaco Evergraph on 13 April, against 142 new ads the week before.
This is reverse engineering in the plain sense. Nothing is hidden, but nothing is assembled either until someone dates, tags and de-duplicates it.
From “What Happened” to “What Should I Do”
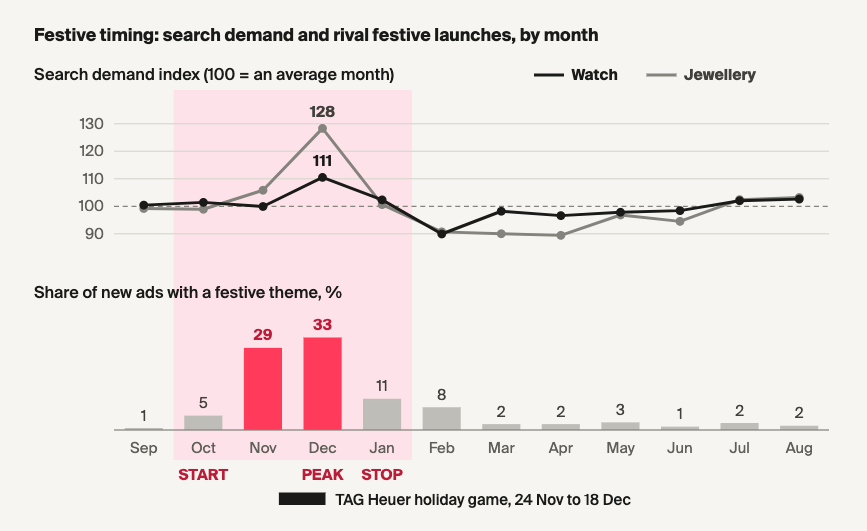
Description is no longer scarce. A recommendation needs a question, evidence from more than one domain and a rule set in advance. Festive timing is a case in point. LuxuryIQ’s Meta ad data shows rivals’ festive launches rising from 5% of new watch and jewellery ads in October to 29% in November and 33% in December, before falling to 11% in January.
Demand follows the same curve. Google search for watches reaches an index of 110.5 in December and jewellery 128.3, where 100 is an average month. DLG’s rule is to start the month before festive creative passes 20% of competitor launches, which points to an October start, ahead of the rival wave.
Source: LuxuryIQ, Google Keyword Planner search volumes for watch and jewellery (month-of-year index, average of 2023 to 2025) and Meta Ad Library new ads tagged as watches or jewellery, September 2025 to August 2026.
Range planning follows a similar logic. Set against Breitling in the US catalogue for August 2026, TAG Heuer’s gaps lie in materials rather than sizes. Breitling lists 18 ceramic watches against TAG Heuer’s two, plus four each in bronze and platinum, where TAG Heuer has none. The reading points to testing ceramic first, while protecting titanium at 39 to 41 mm, where TAG Heuer has 19 products and Breitling none.
Social data, meanwhile, tests received wisdom. Between April and September 2026, weekend days carried 10.2% and 10.8% of peer Instagram posts, against 14.4% to 17.1% on weekdays. Yet the typical brand’s median Saturday post earned about 2,100 engagements, in line with weekdays. The weekend looks like empty space, but it is not a weak spot.
Reports in Minutes
This is where my fifteen years meet the argument. The days I used to spend on a report went mostly on three things: pulling data from different places, reconciling what each source meant and drawing the same charts again. A governed layer removes all three. The atlas behind LuxuryIQ holds 271 chart definitions and 251 business questions, each with its source and its rules, so a brand, a competitive set and a window are enough for an assistant to assemble a first draft in minutes.
The judgement stays human. What remains is what was always the job: deciding which finding matters to the client, checking the draft against what you know and signing it. I do not type less than I used to. The checks now live in the system rather than in my head at eleven at night.
Any provider, DLG included, should be able to answer three questions: whether an answer shows its source, its window and its sample size; whether it applies written method rules or leaves the judgement to the model; and whether every recommendation comes with a threshold set in advance. A vendor that cannot answer the third is asking you to take the number on trust.
Intelligence on the Record
As the market rewards precision over momentum, the value of AI for luxury houses lies less in how quickly it answers than in whether the answer can be traced. Return to the CMO at 8:02. The same question now arrives with its window and its sample behind it. It takes the same four seconds, but this time someone briefed the analyst.
Benjamin is a 360° Search & Performance Marketing expert. Before joining DLG in 2019, he gained experience on a global scale by working with international agencies such as Publicis, Edelman and FCB.
The newly released WeChat Luxury Index examines how high-end and luxury brands achieve marketing or business objectives on WeChat. The report also showcases a ranking of these brands, evaluating whether their offerings and services on WeChat are developed enough to meet the sophisticated demands of today’s consumers.
In an exclusive interview for The Luxury Society Podcast’s inaugural episode, TAG Heuer CEO Antoine Pin reveals how the brand’s historic return to Formula 1 aims to conquer new markets, seduce younger consumers, and win the ultimate battle: The one for our wrists.
There is an unspoken rule in heritage brand design: the more storied the maison, the more it should disappear. Let the product speak, let the archive breathe, keep the identity quiet and the palette restrained. The brand as vessel, not voice.
FOMO is out. FOBO – the Fear of Becoming Obsolete – is the defining anxiety of our professional moment. For an industry built on permanence, heritage, and the primacy of the human hand, it may also be the only fear worth taking seriously.